01
Microbial activity
Microbial communities contribute to nutrient cycling and biological soil functions.
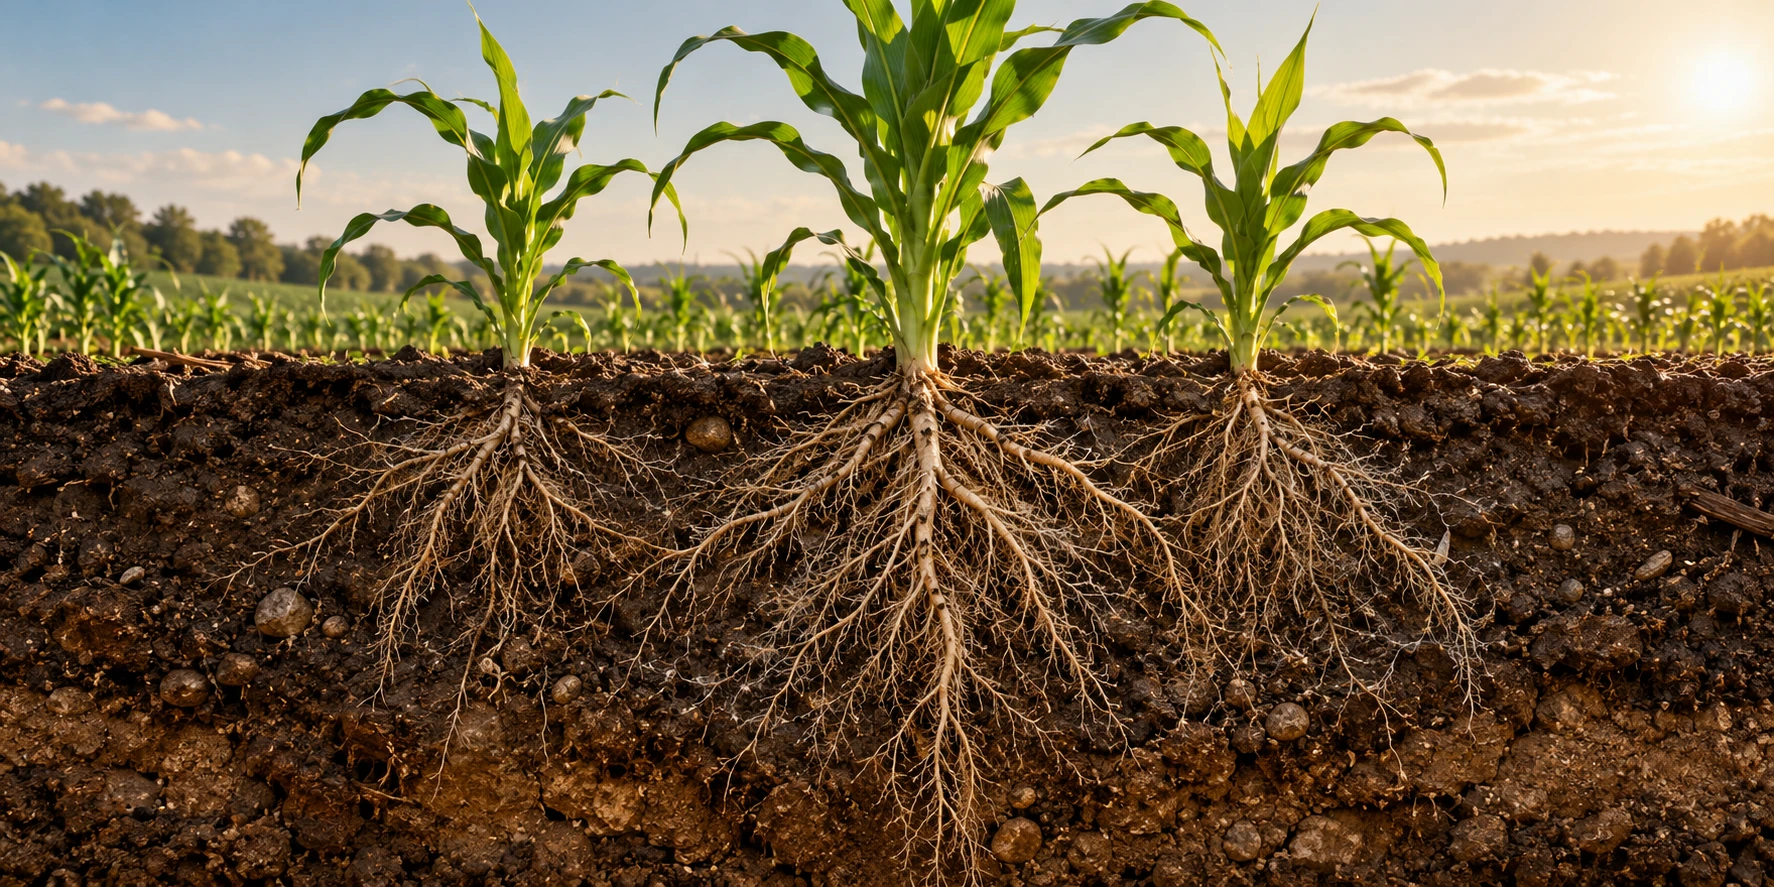
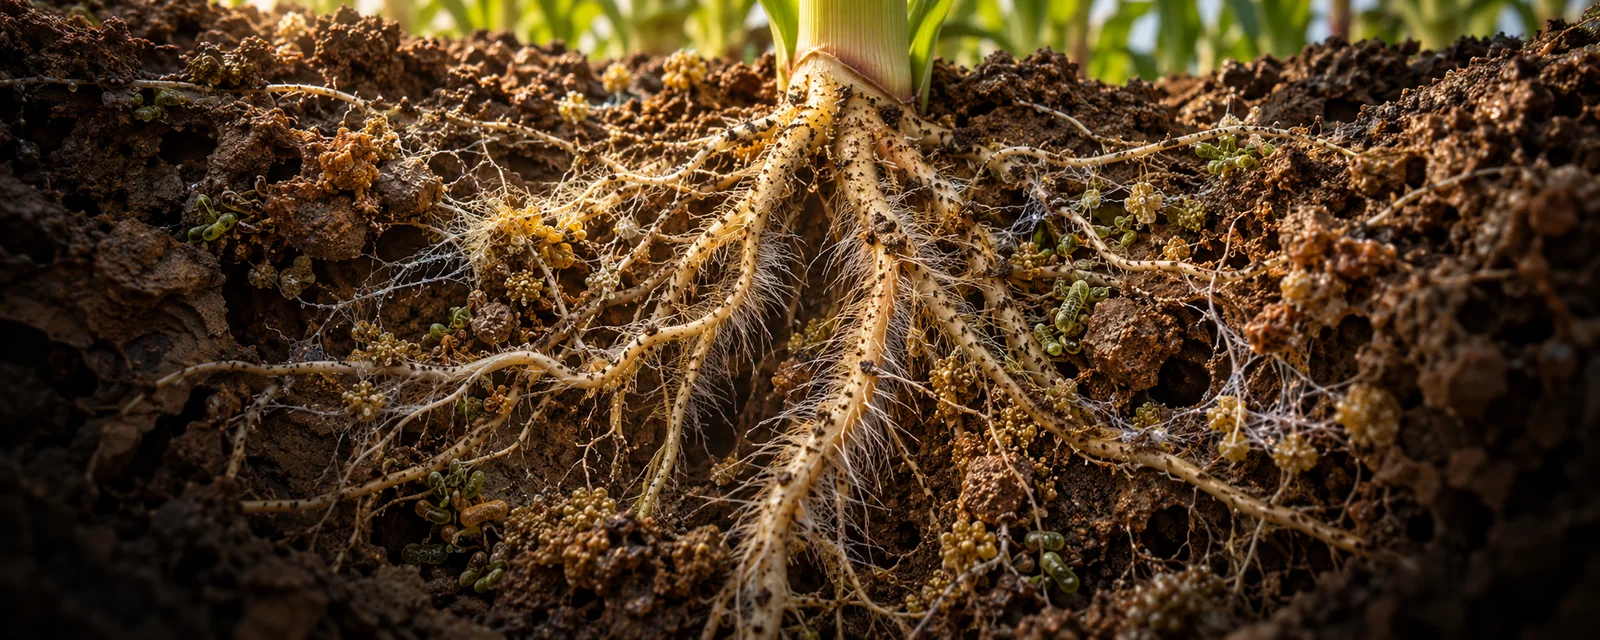
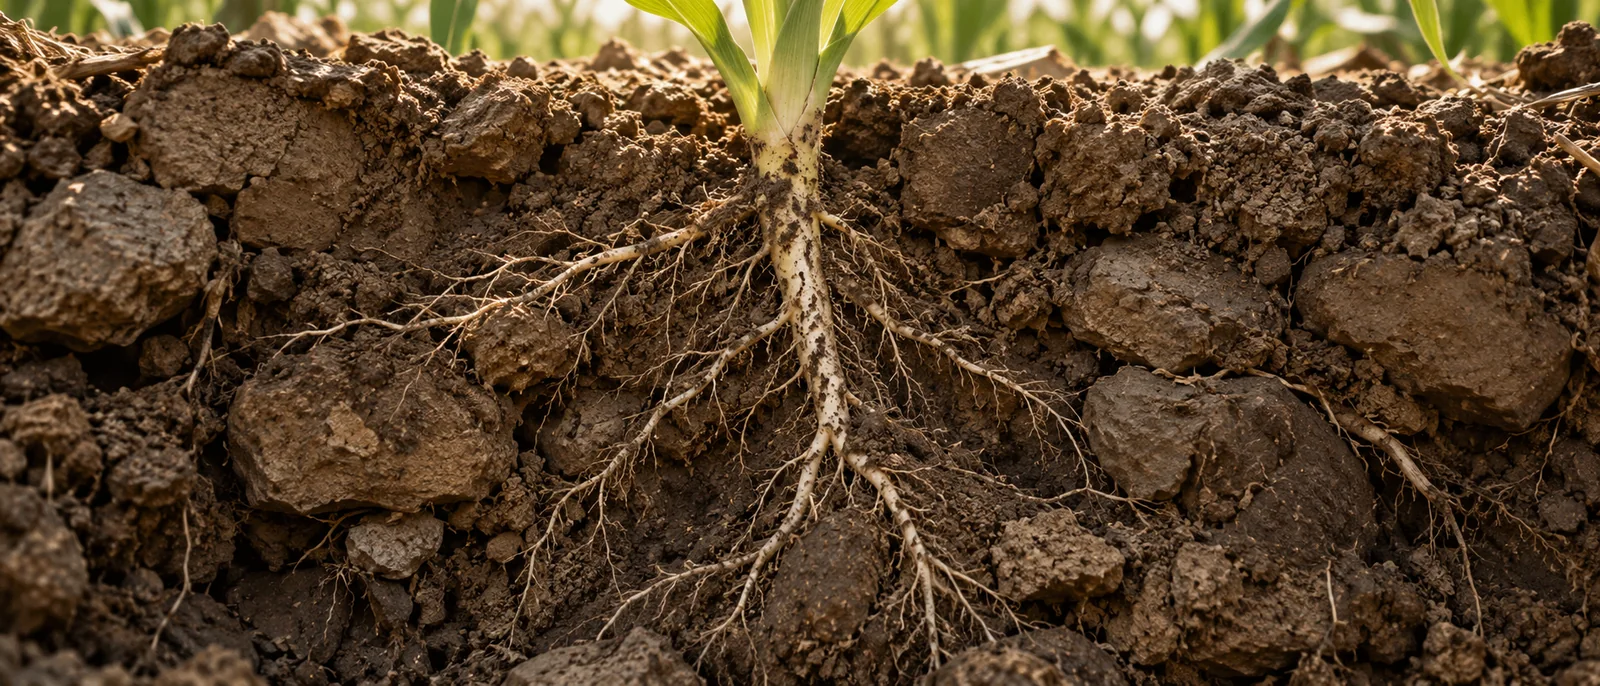
Healthy soil is alive. Explore the biological differences between underperforming and healthy soil — from microbial activity to structure and root interaction.
Drag the divider or use the arrow keys to compare the two illustrative soil environments.
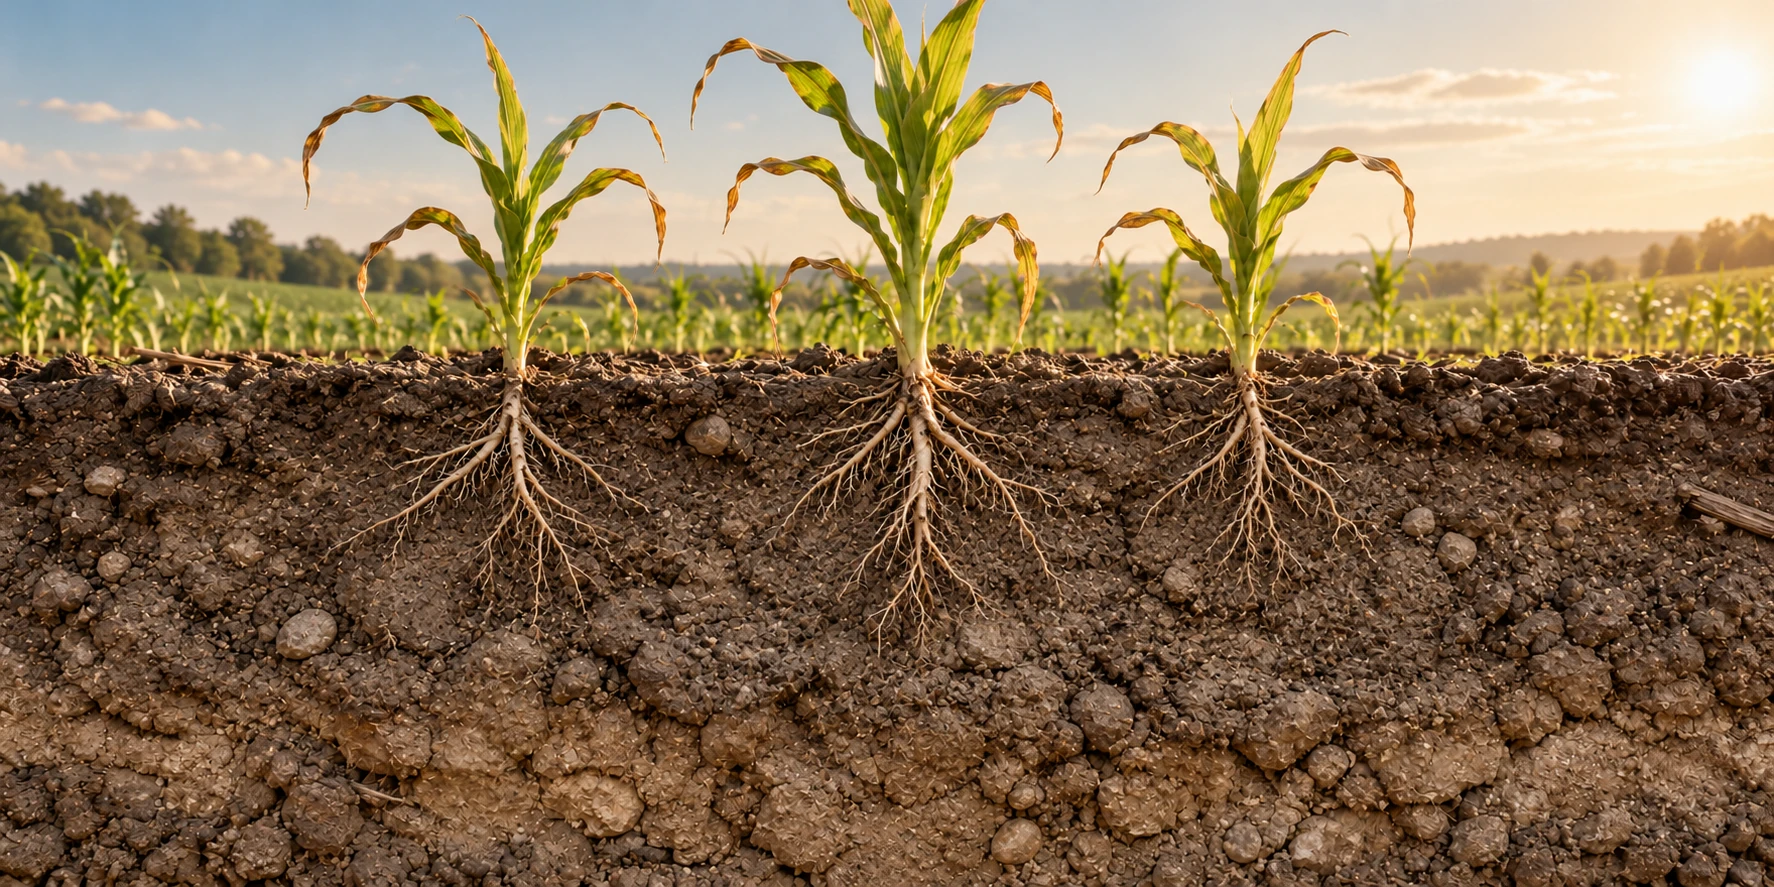
STRUCTURE Underperforming soil is illustrated with denser structure and limited pore space.
ROOT ZONE Healthy soil is illustrated with more open structure and root exploration.
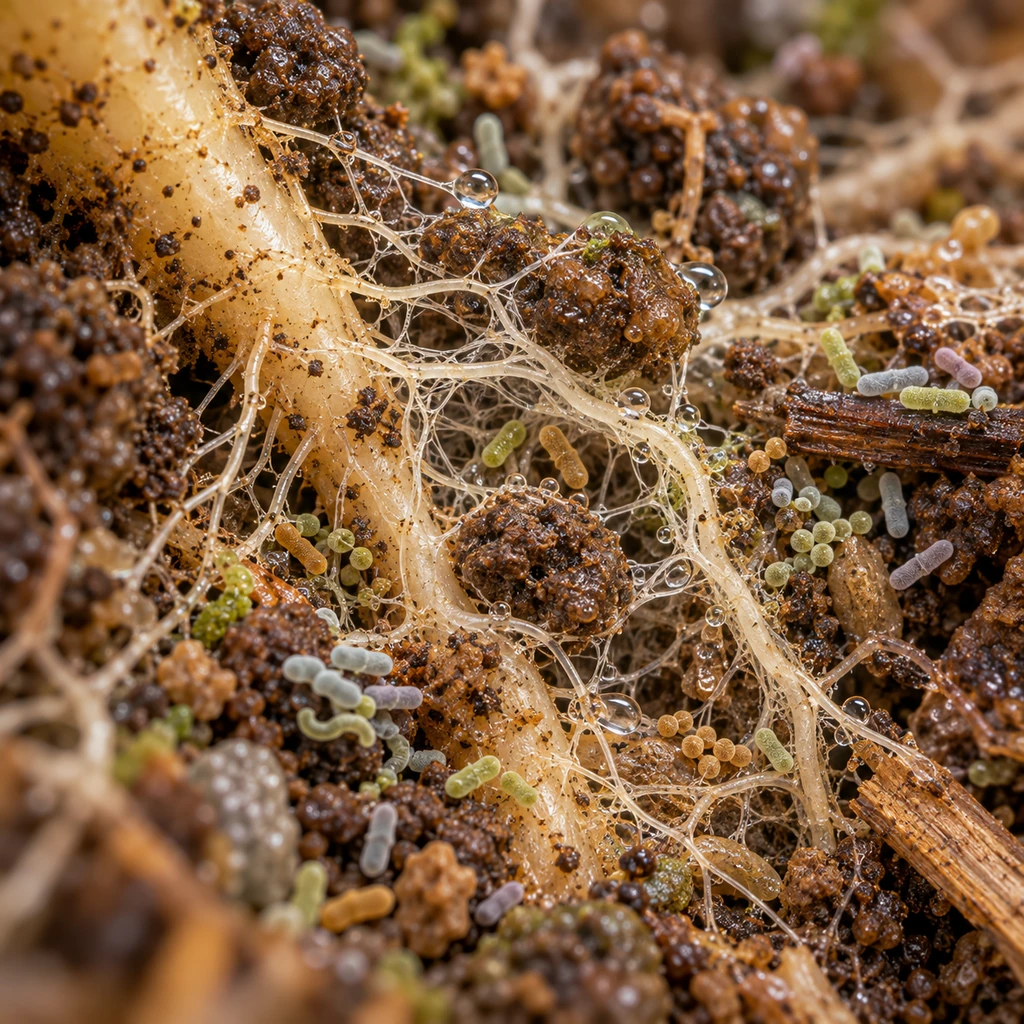
A living microbial ecosystemMicroorganisms interact with roots and organic matter, contributing to nutrient cycling and soil functions.
Microorganisms interact with roots and organic matter, contributing to nutrient cycling and soil functions.
Microbial communities contribute to nutrient cycling and biological soil functions.
Soil aggregation and pore spaces influence the movement of air and water.
Root networks interact with their surrounding biological environment.
DIAGNOSE
By comparing your soil's microbiome profile with a suitable reference, we can investigate biological differences and the microorganisms that may need support.
A reference is chosen for comparable conditions. The example below uses illustrative units to explain the diagnostic logic.
Select a microorganism to highlight healthy soil, your soil and the illustrative gap.
Example: healthy soil 100, your soil 45; combined difference 55 illustrative units.
The differences we identify become the starting point for a targeted biological strategy.
See how we prioritizeMicroorganism A–E are illustrative groups, not named species. Values are illustrative units, not lab results or treatment doses. The healthy soil standard depends on crop and site.
PRIORITIZE
The differences identified in your soil help us prioritize the microorganisms furthest from the standard and evaluate biological inputs suited to the site's needs.
The same five microorganisms and values continue from the comparison. A percentage guides investigation; it is not an input dose.
Microorganisms
Your soil: 45% of the healthy soil standard
Priorities
Each percentage shows how much of the healthy soil standard your soil reaches for that microorganism. It describes review priority, never a product recipe or promised outcome.
Microorganism A: your soil has 12 of 30 units, 40% of the healthy soil standard.
Each soil has its own biological signature. Evaluate support that makes sense for its conditions.
Revisit the diagnosisIllustrative model only. Percentages compare your soil with an illustrative healthy soil standard. Input selection also depends on crop, soil chemistry, native communities, viability, formulation, and field feasibility. The percentages are not a microbial mixture proportion or dosage.
RESTORE
We use your microorganism results to design a TERAbiom solution that helps bring your soil closer to healthy soil.
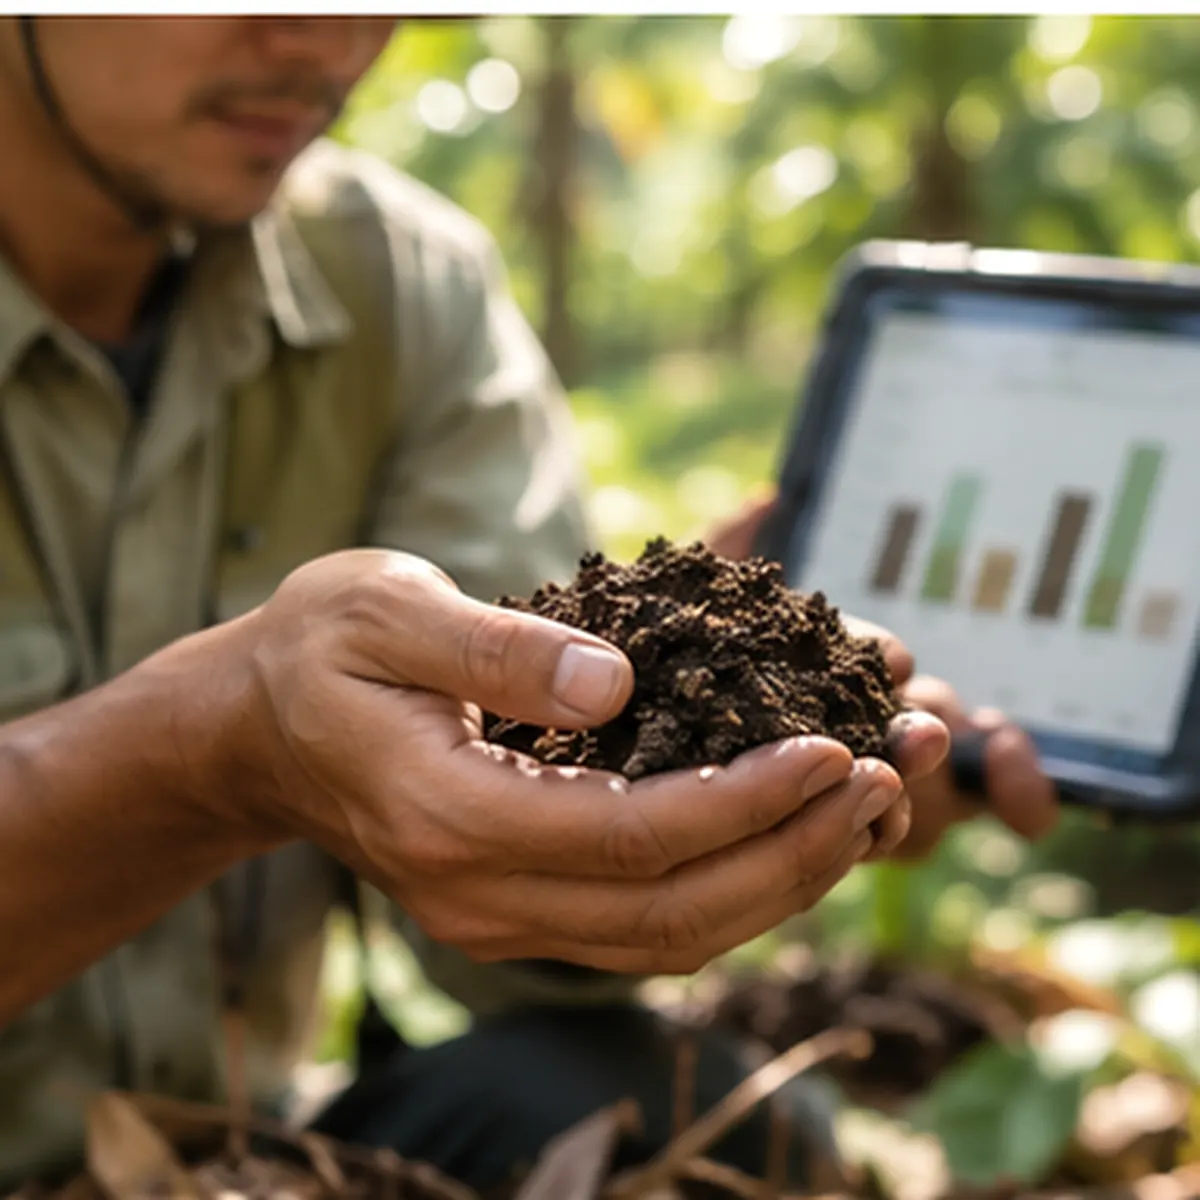
Your microorganism gaps show what your soil is missing.

We match a TERAbiom solution to the microorganisms your soil lacks.
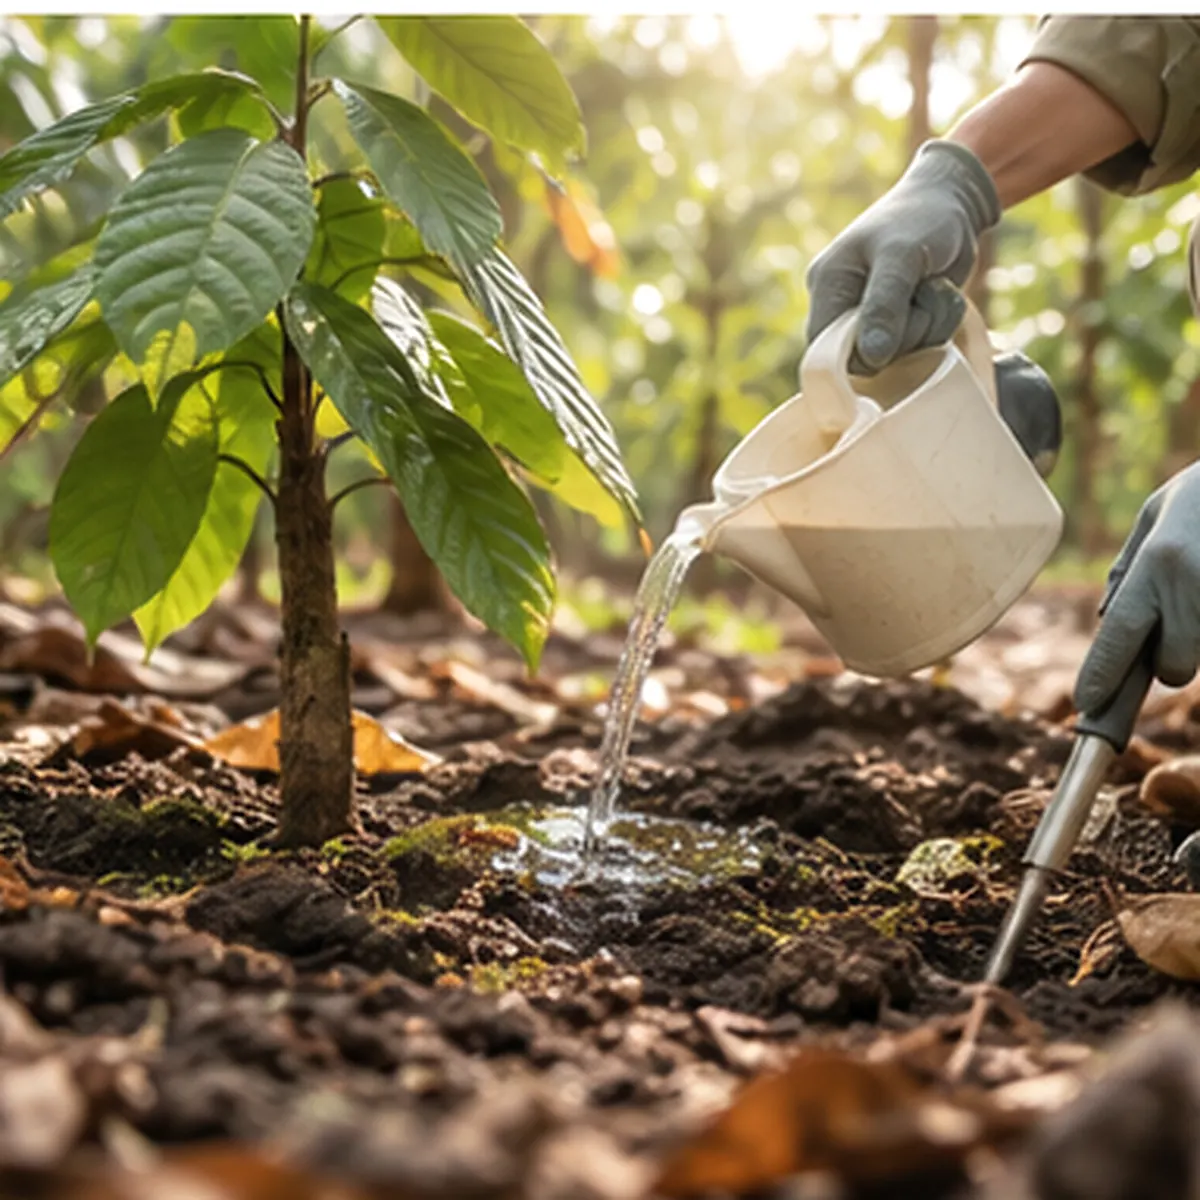
Apply it in the field, then re-test to track progress toward healthy soil.
Illustrative. Results depend on crop, soil and field conditions.
Turn soil insights into practical action, from testing to targeted improvement.